
Fig. 3.
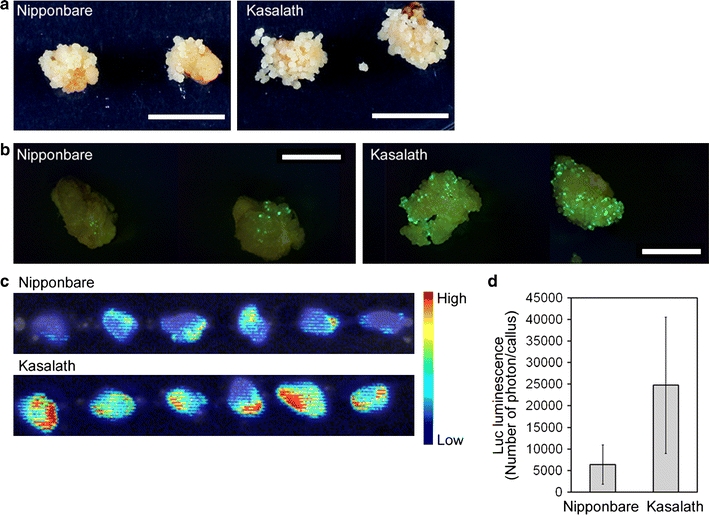
Transformed primary calli of Nipponbare and Kasalath. a Transformed callus 14 days after the onset of selection. Hyg-tolerant cells were grown from all transformed callus of Kasalath, whereas only some transformed callus of Nipponbare grew. b Representative images of green fluorescence (viewed under blue light) emitted from callus transformed with pCAMBIA1390-sGFP 8 days after the onset of selection. Bar 5 mm. Other images are shown in Online Resource 2a. c Luminescence emitted from callus transformed with pCAMBIA1390-Luc just after the onset of selection. Luminescence intensity is shown by the false color scale. d Graphical representation of the Luc luminescence intensity emitted from the transformed Nipponbare or Kasalath calli shown in Fig. 3c. The y axis shows luminescence level (photon) per callus. Data are presented as mean ± SD (n = 75). Significant difference between Nipponbare and Kasalath at P < 0.01 as determined by t test