
Fig. 6.
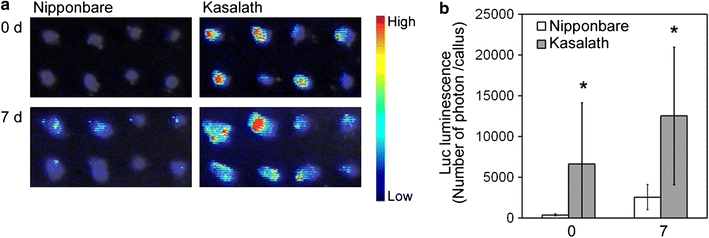
Transformed secondary calli of Nipponbare and Kasalath. a Luminescence emitted from secondary callus transformed with pCAMBIA1390-Luc 0 or 7 days after the onset of Hyg selection. Luminescence intensity is indicated by the false color scale. b Graphic representation of the Luc luminescence intensity emitted from the transformed Nipponbare (white bars) or Kasalath (gray bars) calli shown in a. The y axis shows luminescence level (photons) per callus. Data are presented as mean ± SD (n = 40). The experiments were performed twice using different samples. Similar results were obtained in another experiment. Asterisks indicate significant difference between Nipponbare and Kasalath at P < 0.01 as determined by t test