
Fig. 7.
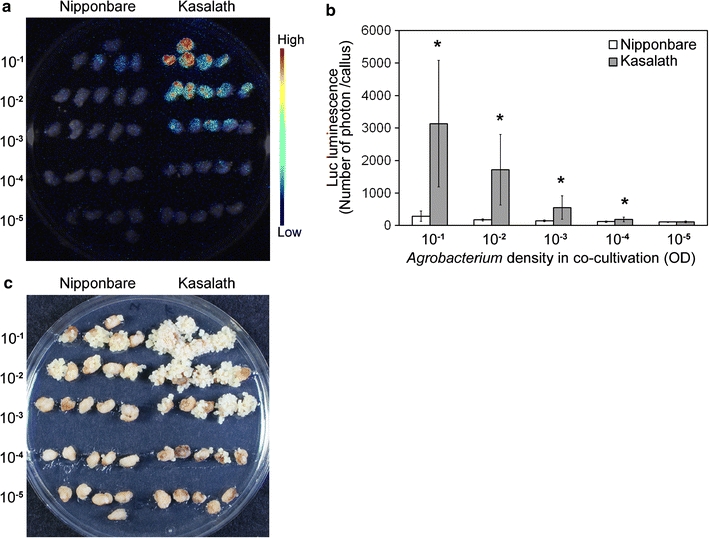
Effect of Agrobacterium density on transformation frequency. a Luminescence emitted from callus transformed with pCAMBIA1390-Luc just after the onset of Hyg selection. Luminescence intensity is indicated by the false color scale. b Graphical representation of the Luc luminescence intensity emitted from the transformed Nipponbare (white bars) or Kasalath (gray bars) calli shown in a. The x and y axes show Agrobacterium density in co-cultivation and luminescence level (photon) per callus, respectively. Data are presented as mean ± SD (n = 10). The experiments were performed twice using different samples. Similar results were obtained in both experiments. Asterisks indicate significant difference between Nipponbare and Kasalath in each Agrobacterium density at P < 0.01 as determined by t test. c Hyg-tolerant cells 14 days after onset of selection. 10−1 to 10−5 Agrobacterium density in co-cultivation with rice callus (OD600). The frequencies of Hyg-tolerant cells are listed in Table 3