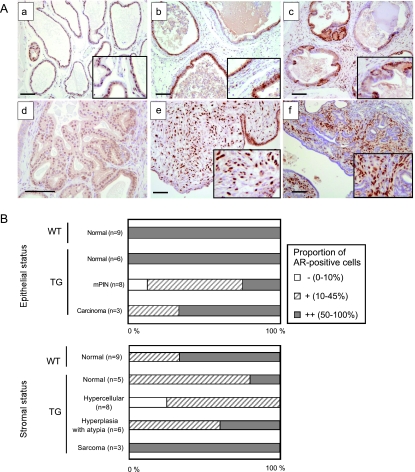
Figure 6.
FGF-8b TG mouse prostates present altered AR staining. (A) IHC staining of AR in VP of a WTmouse (a), in TG prostate with stromal hypercellularity and inflammation (b), in an mPIN focus of a TG mouse (c), in adenocarcinoma (d), in sarcoma (e), and in carcinosarcoma (f). Magnification: all, x100; d, x200. Inserts, x200. Scale bars, 100 µm. (B) Staining grades in AR IHC in VP epithelium (upper graph) and stroma (lower graph) of WT and TG mice with normal and altered histology. Grades were evaluated as proportion of AR-positive cells in the VP areas with respective changes as indicated in the Materials and Methods section.

