Figure 3.
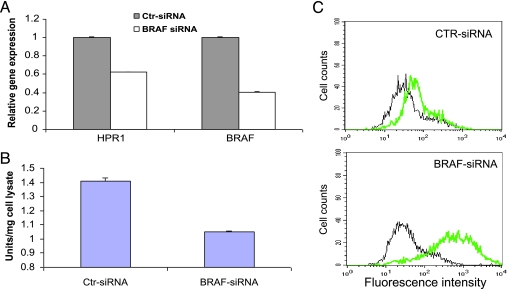
BRAF gene knockdown leads to decreased HPR1 expression and increased cell surface HS levels. (A) Real-time RT-PCR analysis of HPR1 and BRAF mRNA. Total RNA was extracted from KAT-10 cells and analyzed for HPR1 and BRAF mRNA by real-time RT-PCR. One of two experiments in triplicate with similar results is shown. (B) HPR1 enzymatic activity. Cell lysates of KAT-10 cells transfected with control or BRAF siRNA were analyzed for HPR1 activity by ELISA. (C) FACS analysis of the cell surface HS levels. Single cell suspensions of KAT-10 cells transfected with control or BRAF siRNA were analyzed for cell surface HS levels by FACS. Black line indicates IgM control; green line, anti-HS mAb.

