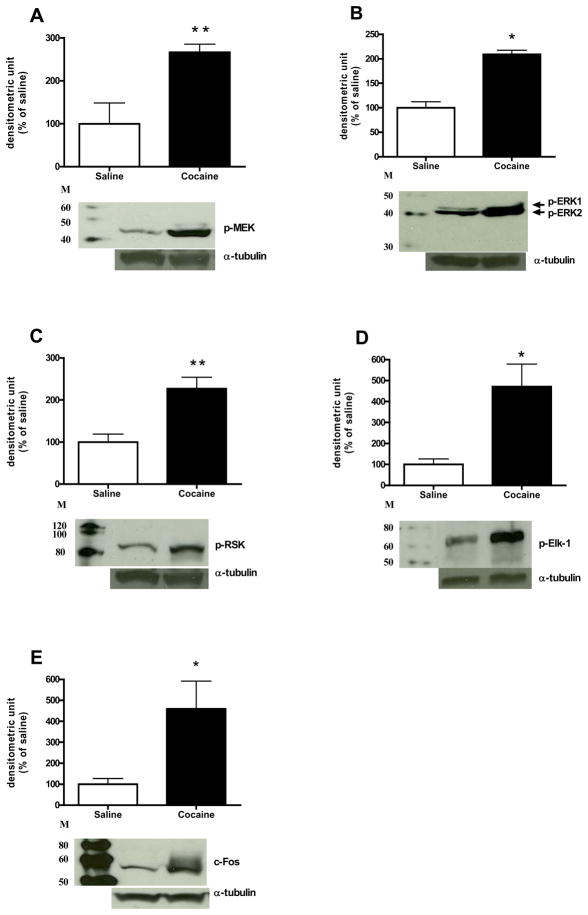
Fig. 1.
Effects of cocaine on ERK pathway. Results represent as protein levels over α-tubulin in the CPu expressed as percentage of saline control (4–5 animals per group). 10 min after rats were given injections: (A) p-MEK; (B) p-ERK (p-ERK1/2) and total ERK1/2; (C) p-RSK; (D) p-Elk-1. 45 min after rats were received injections: (E) c-Fos. M is the molecular marker in kDa. *p <0.05, **p <0.01 and ***p <0.001 as compared with saline group.

