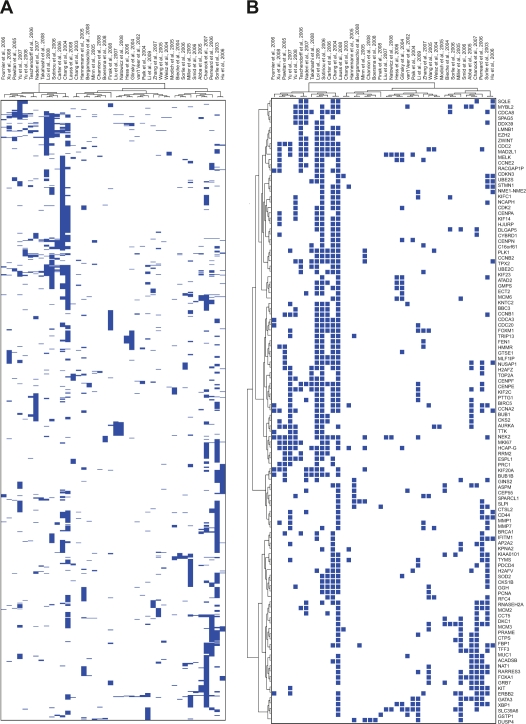
Figure 1.
Overlap beween gene identifiers across 42 breast cancer gene expression signatures. A) Heatmap representation of 946 genes overlapping in more than one gene expression signature. B) Heatmap representation of 117 genes overlapping in at least 5 out of 42 gene expression signatures analyzed. Easch row is a gene and each column is a breast cancer gene expression signature. Presence of a gene is indicated by a blue box, and absence is white.

