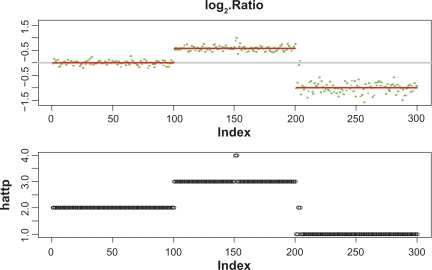
Figure 3.
Application of the CBS method to the sequence of the median of the logarithm of the ratios (top panel). The red bars show the values of the estimation of log2(tp/2). Application of the linear-median method to the data in Example 3 (bottom panel), showing the estimates of tp at each probe position.

