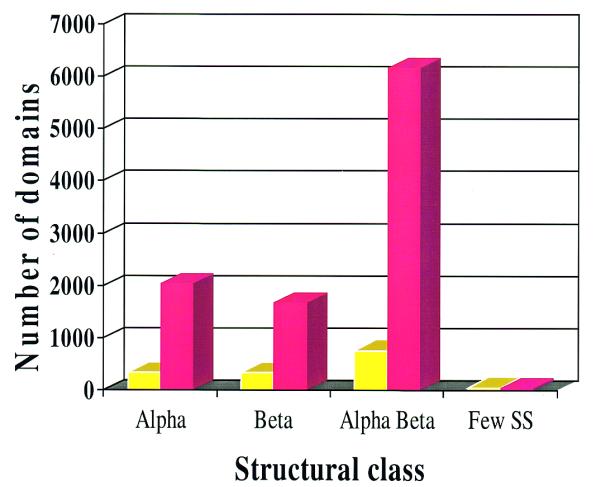
Figure 1.

Distribution of sequence families with close structural relatives (>35% identity) in the CATH-PFDB database on a class-wise basis are shown in yellow. Sequence families with more distant structural relatives (<35% identity) are shown in red.
