Figure 3.
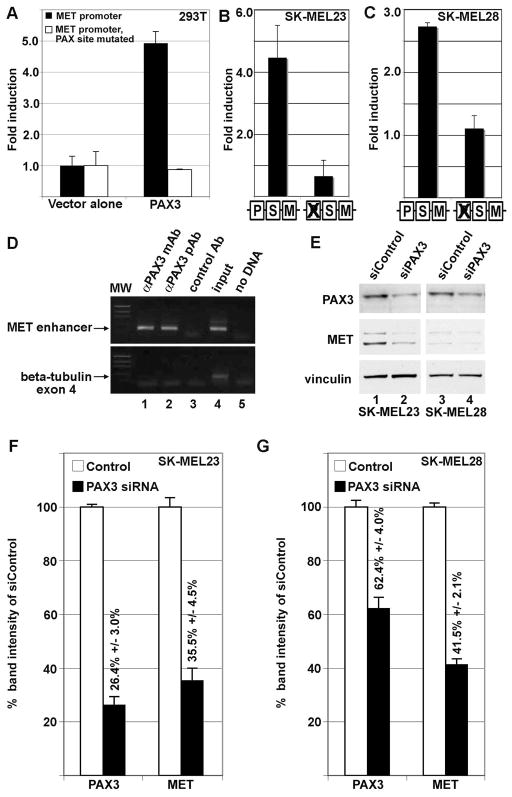
PAX3 activates the MET promoter. (A) PAX3 activates the MET promoter in HEK-293T cells. PAX3 induced luciferase expression 4.9±0.4 fold over vector alone with MET promoter reporter constructs with wild-type sequence (black bars) but not when the PAX site is mutated (white bars). (B,C) PAX3 regulates MET expression in SK-MEL23 (B) and SK-MEL28 (C) melanoma cells. Luciferase reporter is expressed from a construct containing MET promoter when the PAX site is intact or with the PAX site mutated (as illustrated by schematic, as described in Figure 2B). For calculation of fold light units over basal promoter activity (y axis), luciferase activity is measured in arbitrary light units, normalized against beta-galactosidase activity, and divided by the measurements obtained for reporter vector alone. Each bar represents n=9, with standard error of the mean as shown. (D) PAX3 protein is located on the endogenous MET promoter in SK-MEL23 cells. Chromatin Immunoprecipitation (ChIP) analysis utilized primers specific for the MET promoter region (top gels) or for exon 4 of the beta tubulin gene (bottom gels, negative control). Antibodies used for immunoprecipitations are either against PAX3 (monoclonal antibody lanes 1, and polyclonal antibody 2), or normal mouse IgG (control Ab, negative control lane 3). Input DNA was collected for each sample after cell sonication but before immunoprecipitation (lane 4). The “no DNA” lanes lacked a template during PCR amplification (water only, negative control lane 5). (E,F,G) Inhibition of PAX3 protein expression reduces MET receptor levels. Graphs shown in (F) and (G) are quantified densitometry readings of the western analysis shown in (E) of SK-MEL23 cells (lanes 1 and 2) or SK-MEL28 cells (lanes 3 and 4). Cells were transfected with either scrambled siRNA (E, lanes 1,3, F,G white bars) or gene specific siRNA (E, lanes 2,4, F,G black bars). For densitometry readings, bars represent percent of band intensity of the experimental sample compared to the controls, and these percentages are also indicated above each bar. This experiment is a representative of three independent western analyses.

