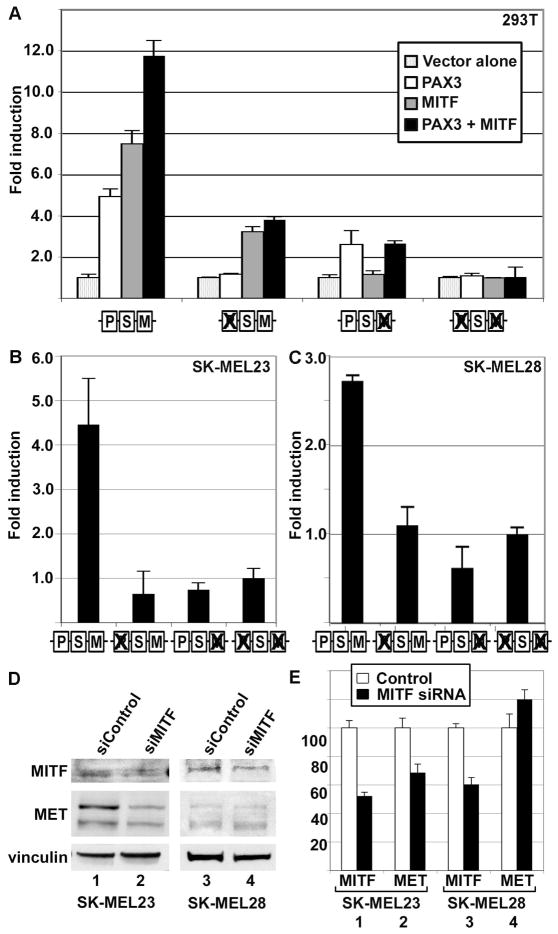
Figure 4.
MITF activates MET, and PAX3 does not inhibit this activation. (A) MITF and PAX3 independently activate the MET promoter in HEK-293T cells. PAX3 induced luciferase expression 4.9±0.4 fold (white bar, first set), and MITF activated luciferase 7.5±0.6 fold over vector alone (grey bar, first set), and both proteins stimulated reporter expression 11.8±0.7 fold (black bar, second set). Ability of PAX3 and/or MITF to drive expression of reporter was eliminated by mutating the specific binding element (as illustrated by schematic, as described in Figure 2B) and reduced but did not eliminate the ability of the other factor to activate through un-mutated sites. (B,C) PAX3 and MITF regulate MET expression in SK-MEL23 (B) and SK-MEL28 (C) melanoma cells. Luciferase reporter is expressed from a construct containing MET promoter when the PAX and/or MITF site is intact or mutated (as illustrated by schematic, as described in Figure 2B). For calculation of fold light units over basal promoter activity (y axis), luciferase activity is measured in arbitrary light units, normalized against beta-galactosidase activity, and divided by the measurements obtained for reporter vector alone. Each bar represents n=9, with standard error of the mean as shown. (D,E) Inhibition of MITF protein expression reduces MET protein levels in SK-MEL23 but not in SK-MEL28 melanoma cells. Graph shown in (E) is the quantified densitometry readings of the western analysis shown in (D). Numbers of the bar sets shown in (E) correspond to the lane numbers shown in (D). Cells were transfected with either scrambled siRNA (D, lanes 1,3, E white bars) or gene specific siRNA (D, lanes 2,4, E black bars). For densitometry readings, graphs represent percent of band intensity of the experimental sample compared to the control. In SKMEL23 cells, inhibition of MITF expression (52.3%±2.5% of controls, bar set 1 in E) leads to an inhibition of MET expression of 68.6%±5.9% (bar set 2). In SK-MEL28 cells, inhibition of MITF expression (60.4%±4.8%, bar set 3) did not lead to a significant change in MET protein levels (119.%8±6.9%, bar set 4). This experiment is a representative of two independent western analyses.

