
Figure 4.
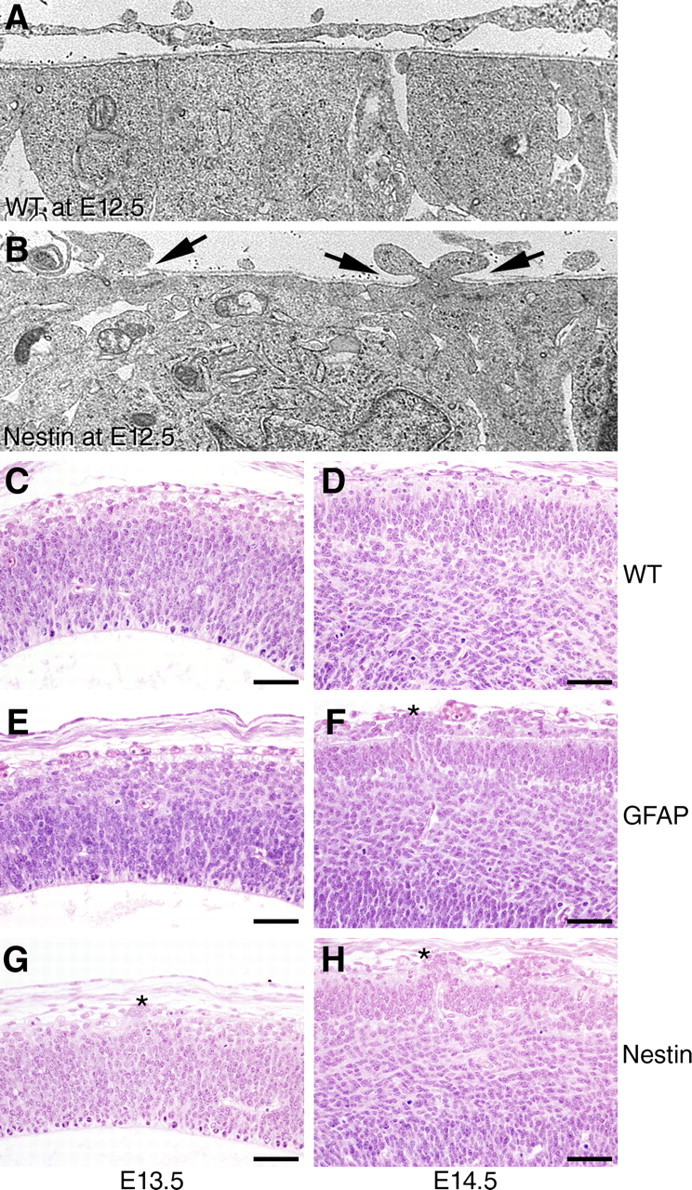
Temporal differences in cerebral cortex pathology in dystroglycan-null mice. A, B, Electron micrographs of E12.5 cerebral cortex (A, littermate control; B, Nestin-Cre/DG-null). Arrows in B mark the locations of basement membrane disruption where cell processes protrude into the subarachnoid space. C–H, Hematoxylin- and eosin-stained sections from E13.5 (C, E, G) and E14.5 (D, F, H) cerebral cortices from wild-type littermate (C, D), GFAP-Cre/DG-null (E, F), and Nestin-Cre/DG-null (G, H) mice, showing that pathology in Nestin-Cre/DG-null mice is first apparent at the light microscopy level at E13.5, and that pathology in GFAP-CRE/DG-null mice is first apparent at E14.5. Asterisks denote glial/neuron heterotopia. Scale bars, 50 μm.