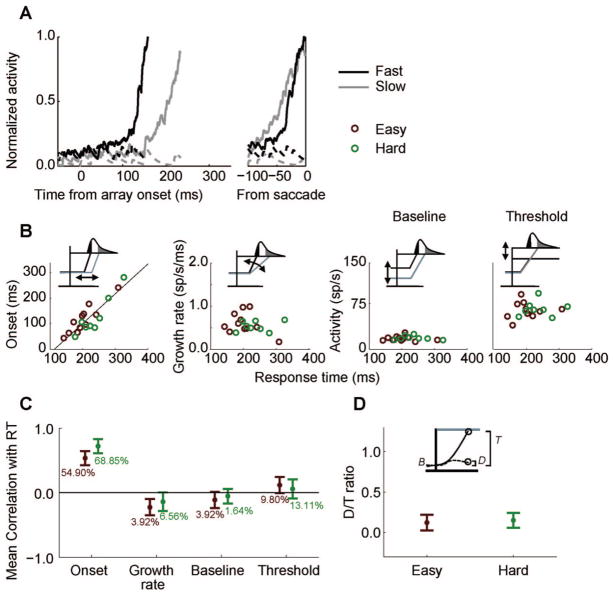
Figure 10.
Movement neuron activity. A: Activity for a representative movement neuron from fast and slow trials (average activity from 10 consecutive trials at the 0.1 and 0.9 response time [RT] quantiles). B: Scatterplots of neural measurements plotted versus RT. Insets illustrate the pattern of activity implicated by a significant correlation. C: Mean correlation across all movement neurons. Percentages of neurons with significant correlation are shown below. D: Mean distractor/target (D/T) ratio. Error bars are 95% confidence intervals. Easy trials are in red, hard trials in green. Fast trials are in black, slow trials in grey. Inset illustrates calculation. sp/s = spikes per second.

