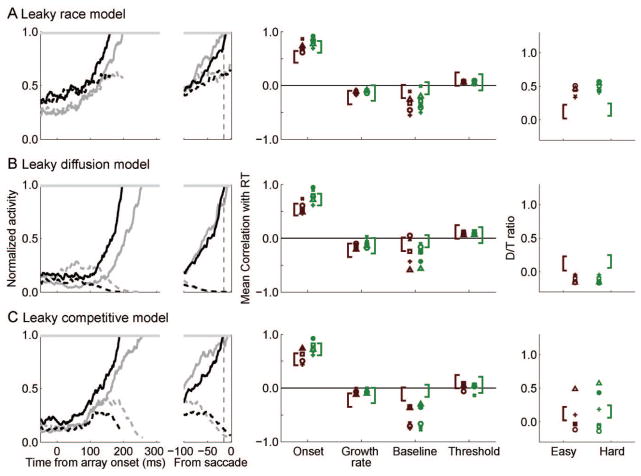
Figure 12.
Simulation results: leaky accumulator models. The left panels plot the sample trajectories for the race (Panel A), diffusion (Panel B), and competitive (Panel C) models. The left panels plot model activation from fast and slow trials (average activity from 10 consecutive trials at the 0.1 and 0.9 response time [RT] quantiles). The center panels plot the mean correlation for simulated data. The right panels plot the mean predicted distractor/target (D/T) ratio. Brackets are 95% confidence intervals around observed mean values. Symbols indicate Data Sets F (○), L (+), Mm (△), Mc (x), Q (●), and pooled (□). Easy trials are in red, hard trials in green.

