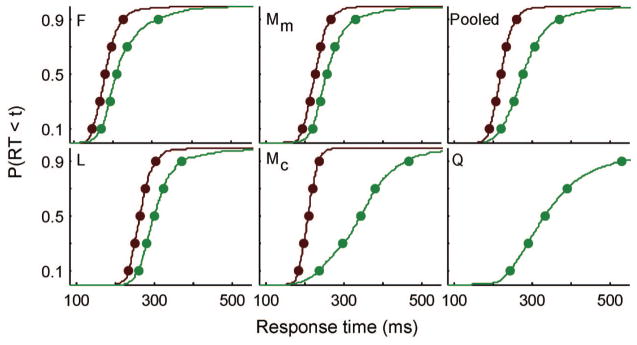
Figure 6.
Observed behavioral data. Cumulative distribution of correct response times (RTs). RTs from easy trials are red, hard are green. Each panel indicates a different data set. Monkey F (color search), L (motion search), M (Mc = color, Mm = motion search), pooled (Vincentized RT distribution from F, L, and M), and Q (form search).

