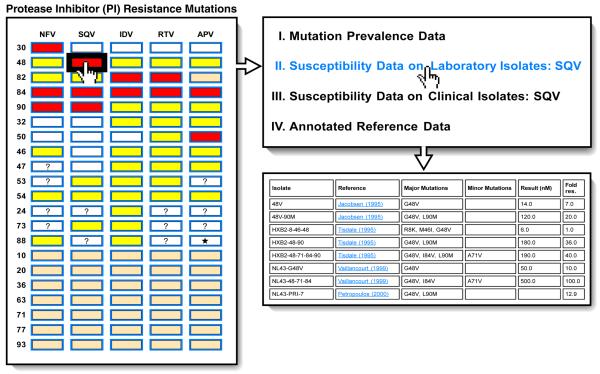
Figure 1.
Protease mutations and their relationship to protease inhibitor drug susceptibilities. Drug names are shown at the top of the columns. Amino acid positions are shown at the left of each row. NFV, nelfinavir; SQV, saquinavir; IDV, indinavir; RTV, ritonavir; APV, amprenavir. Red rectangles denote primary resistance mutations. Yellow rectangles denote mutations that contribute to resistance when present with other mutations. Pale yellow rectangles represent mutations that are accessory resistance mutations which also occur as polymorphisms in untreated individuals. Rectangles containing a question mark imply that the relationship between the mutation and drug resistance has not been fully defined. Rectangles containing a star imply that the mutation causes hypersusceptibility to the drug shown at the top of the column. Each rectangle is hyperlinked to a page containing the four types of data shown in the top right box that link mutation and drug. An example of one of these types of data (e.g. SQV susceptibilities of laboratory isolates containing G48V) is shown in the bottom right box.

