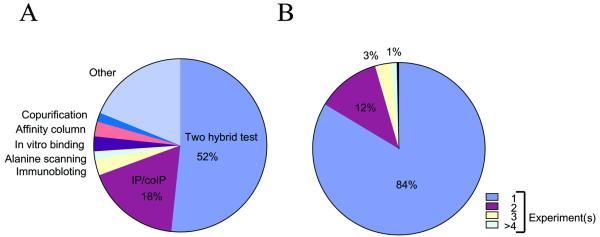
Figure 1.
(A) The distribution of experimental methods for detecting the protein–protein interactions documented in DIP. The most popular methods are shown in the pie chart. For a complete list of techniques see http://dip.doe-mbi.ucla.edu. (B) Crossvalidation of protein–protein interactions: 84% of the interactions are observed in only a single experiment, but a growing fraction is observed by multiple experiments.

