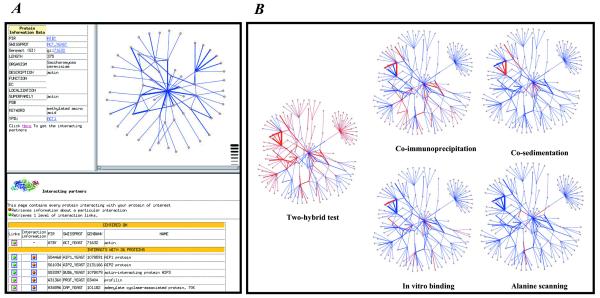
Figure 3.
(A) An example of a DIP web page centered on the yeast actin shows how users can graphically navigate interaction networks. The upper left frame contains information about the selected protein (i.e. yeast actin). The upper right frame contains a graphical representation of the network within two interactions from yeast actin. The lower panel lists interacting partners of the selected protein (only partly shown here). (B) Graphical representation of the protein interaction network within three interactions from yeast actin. Circles represent proteins and lines represent interactions. The line thickness represents the number of experiments detecting a given interaction. Specific methods are highlighted to illustrate their distribution in the network. Blue lines represent any type of methods; red lines depict the selected method.

