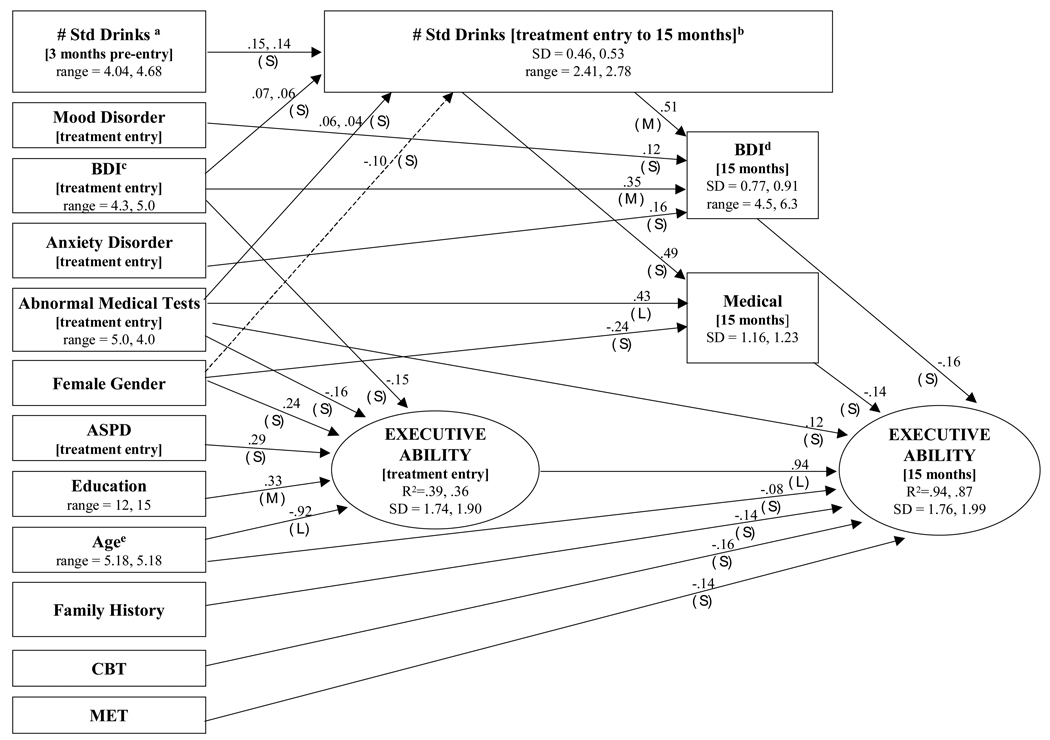
Figure 2.
Risk factor Path Model. All significant paths were replicated across outpatient and aftercare samples with the exception of the path from female gender to alcohol consumption (dashed line). When unstandardized outpatient and aftercare path coefficients or standard deviations differed, the outpatient value was listed first. For dichotomous variables, the unstandardized path coefficients represent the difference between the ability means of the two groups. The point ranges of continuous variables are shown in parentheses; standard deviations (SD) of the latent factors and continuous manifest variables are provided because the effect sizes of unstandardized path coefficients need to be interpreted with respect to the standard deviations of the variables. For the readers’ convenience, paths with estimated effect sizes (ES, unique proportion of variance explained) <.10 were coded as small (S), ES = .10 – .24 as medium (M), and ES = .25 and up as large (L) (Murphy & Myors, 2004). Note that several continuous variables were rescaled to facilitate iterative estimation: # Std Drinksa = square root (# Std Drinks/300); # Std Drinksb (treatment entry to 15 months) = square root (# Std Drinks (treatment entry to 15 months/1800); BDIc = BDI/10; BDId = BDI/10; and Agee = Age/11.

