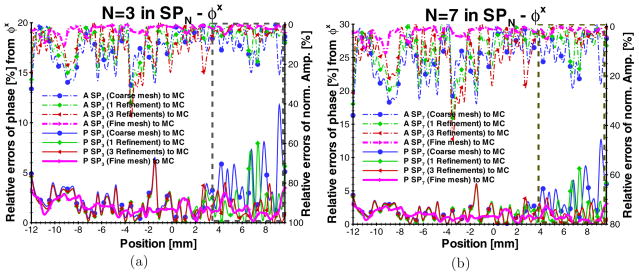
Figure 8.
Comparisons of φx between SP3, SP7 and the Monte Carlo method in the digital mouse phantom (MOBY). The modulation frequency is 100 MHz. ‘A SP3,7 (*) to MC’ and ‘P SP3,7 (*) to MC’ denote the relative errors of the excitation amplitude and phase shift on different fixed and adaptively refined meshes. The dash-dot rectangles are used to show the part of the significant error reduction due to the adaptive mesh evolution.

