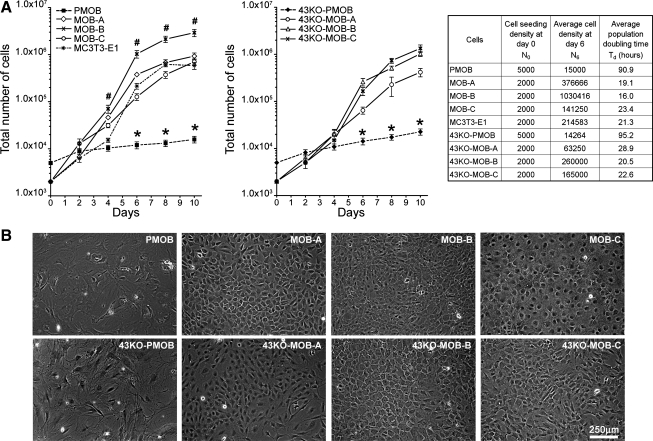
Fig. 3.
A: growth kinetics for hTERT-immortalized MOB and 43KO-MOB mouse osteoblastic cell lines. MOBs, 43KO-MOBs, and MC3T3-E1 cells were seeded at 2 × 10³ cells/dish and PMOB and 43KO-PMOB mouse osteoblasts were seeded at 5 × 10³ cells/well in six-well plates and grown in α-MEM supplemented with 10% FBS for 2, 4, 6, 8, and 10 days. All data are presented as means ± SE, n = 5; *P < 0.01, #P < 0.05. P values were obtained using one-way ANOVA followed by Tukey's multiple comparison test. Population doubling times were calculated at the 90% cell confluency time point (day 6). B: morphological appearance of hTERT-immortalized cell lines observed by phase contrast microscopy. MOBs, 43KO-MOBs, and MC3T3-E1 were seeded at 2 × 10³ cells/well, and PMOB and 43KO-PMOB were seeded at 5 × 10³ cells/well in six-well plates and cultured for 8 days in α-MEM supplemented with 10% FBS.

