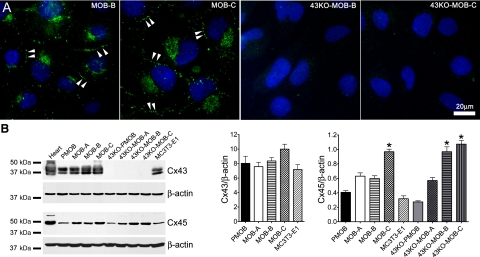
Fig. 4.
A: assessment of Cx43 distribution in some of the hTERT-immortalized MOB and 43KO-MOB mouse osteoblastic cell lines. MOB-B, MOB-C, 43KO-MOB-B, and 43KO-MOB-C were seeded at 1.5 × 10³ cells/cm2 for 6 days and immunostained for Cx43, and cellular distribution of Cx43 was analyzed by epifluorescence microscopy. Double arrowheads, punctate Cx43 distribution at cell-cell appositional membrane. B: Western blot quantification of Cx43 and Cx45 expression levels in MOBs and 43KO-MOBs. Equal amounts of protein from mouse heart (positive control), MOBs, 43KO-MOBs, primary mouse wild-type (PMOB), Cx43-null (43KO-PMOB) osteoblasts, and MC3T3-E1 were used. Western blot analysis was performed using antibodies against Cx43, Cx45, and β-actin. Bar graphs correspond to average Cx43 and Cx45 expression levels determined by densitometric analysis of the Cx43 and Cx45 bands from three independent experiments, using the Scion NIH Image software. All acquired data were normalized with respect to β-actin (internal controls) and expressed as means ± SE, N = 3; *P < 0.05. P values were obtained using one-way ANOVA followed by Tukey's multiple comparison test.

