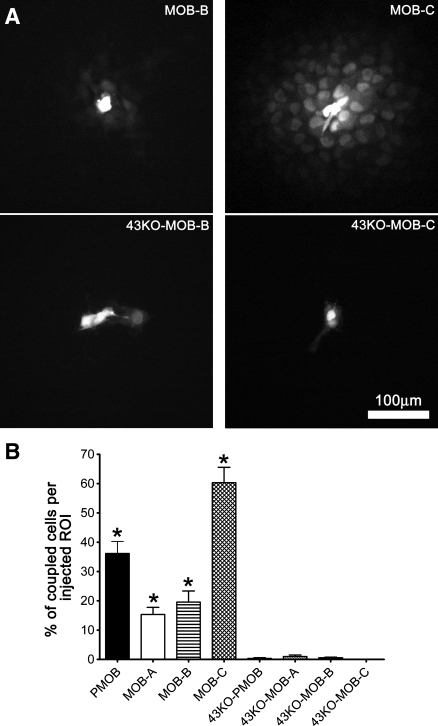
Fig. 5.
Degree of gap junction coupling in the hTERT-immortalized osteoblastic cell lines. A: Lucifer yellow (LY) spread in MOB and 43KO-MOB cell lines. For the fields illustrated, LY spread to 19, 60, 0.5, and 0% of cells in the regions of interest in MOB-B, MOB-C, 43KO-MOB-B, and 43KO-MOB-C, respectively. B: overall quantification of the degree of dye coupling in the hTERT-immortalized osteoblasts, primary wild-type, and Cx43-null osteoblasts cultures. Values correspond to means ± SE, N = 5; *P < 0.0001. P values were obtained using one-way ANOVA followed by Tukey's multiple comparison test.

