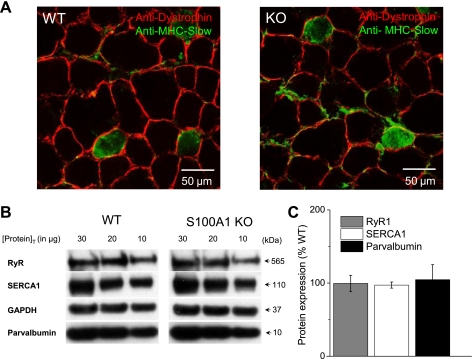
Fig. 5.
Muscle morphology and expression of key excitation-contraction (EC) coupling proteins in S100A1 KO and WT muscle. A: representative tibialis anterior (TA) sections from WT (left) and KO (right) muscle stained with anti-dystrophin (red) and anti-MHC-Slow (green) antibodies. Fiber diameter and the proportion of slow-type fibers were unchanged between WT and KO muscle (Table 1). B: representative Western blots of key proteins in EC coupling. TA homogenates containing 30, 20, and 10 μg protein (to prevent the measurement of saturated signals) were probed for RyR1, SERCA1, and Parvalbumin, with GAPDH used as a loading control. C: protein expression in S100A1 KO muscle, relative to the percent expression in WT muscle. Values expressed as means ± SD (data from three replicates for each protein concentration, each from three different WT and KO TA samples). The expression of key players in EC coupling were unchanged in S100A1-deficient muscle.

