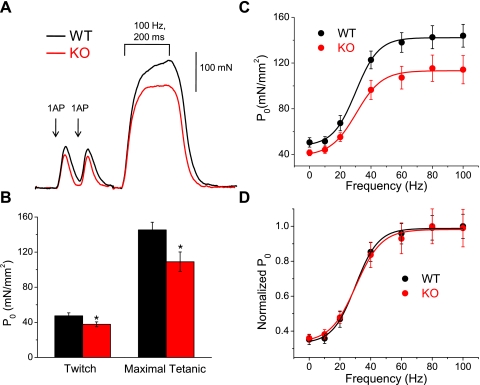
Fig. 6.
S100A1−/− muscle produces less contractile force in vivo. A: representative force recordings from WT and KO animals. The initial two peaks are from single stimuli, whereas the third larger force transient was elicited by a 200-ms, 100-Hz train of stimuli that generated maximal tetanic force. B: pooled data from 9 WT and 10 KO animals. Twitch force was significantly reduced ∼23% in KO animals (P < 0.05), while maximal tetanic forcewas reduced ∼25% (P < 0.01). C: specific force (P0) plotted vs. the frequency of stimulation for 8 WT and 9 KO animals. Continuous line is the best fit of a sigmoidal function (Eq. 1 in text) to each data set. D: normalized force vs. frequency curves shows that the frequency dependency of force generation is similar in WT and KO animals.

