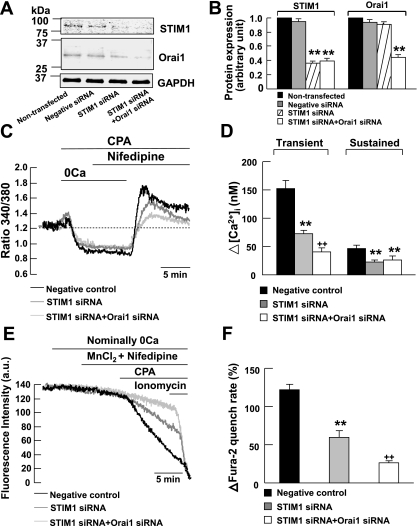
Fig. 3.
STIM1 is associated with Orai1 to mediate CCE in mouse PASMCs. A and B: STIM1, Orai1, and GAPDH proteins were detected in nontransfected mouse PASMCs and in PASMCs transfected with 200 nM scrambled siRNA (negative control). The expression of STIM1 but not Orai1 or GAPDH was reduced significantly in cells transfected with 200 nM STIM1 siRNA. The expressions of STIM1 and Orai1 but not GAPDH were reduced significantly in cells transfected with both 200 nM STIM1 siRNA and 200 nM Orai1 siRNA. Experiments were performed in 3 separate Western blot analyses (**P < 0.01, ANOVA). C: siRNA knockdown of STIM1 reduced the CPA-induced transient and sustained increase in fura-2 fluorescence ratio in the presence of 10 μM nifedipine. siRNA knockdown of STIM1 and Orai1 further reduced the CPA-induced transient but not sustained increase in fura-2 fluorescence ratio in the presence of nifedipine. D: bar graph showing mean changes in transient and sustained increase in [Ca2+]i caused by 10 μM CPA after readdition of 2 mM Ca2+ in the presence of 10 μM nifedipine, in negative control cells (filled bars, n = 103), in STIM1 siRNA-transfected cells (shaded bars, n = 148), and in STIM1 siRNA and Orai1 siRNA-transfected cells (open bars, n = 70). **P < 0.01, compared with negative control cells (ANOVA); ++P < 0.01, compared with negative control cells and STIM1 siRNA-transfected cells (ANOVA). E: siRNA knockdown of STIM1 reduced the increase in Mn2+ quench of fura-2 fluorescence caused by 10 μM CPA in the presence of 10 μM nifedipine. siRNA knockdown of STIM1 and Orai1 further reduced the increase in Mn2+ quench of fura-2 fluorescence caused by CPA in the presence of nifedipine. F: bar graph showing percentage change in fura-2 quench rate after store-depletion in the presence of 10 μM nifedipine, in negative control cells (filled bar, n = 125), in STIM1 siRNA-transfected cells (shaded bar, n = 151), and in STIM1 siRNA and Orai1 siRNA-transfected cells (open bar, n = 137). **P < 0.01, compared with negative control cells (ANOVA); ++P < 0.01, compared with the negative control cells and STIM1 siRNA-transfected cells (ANOVA).

