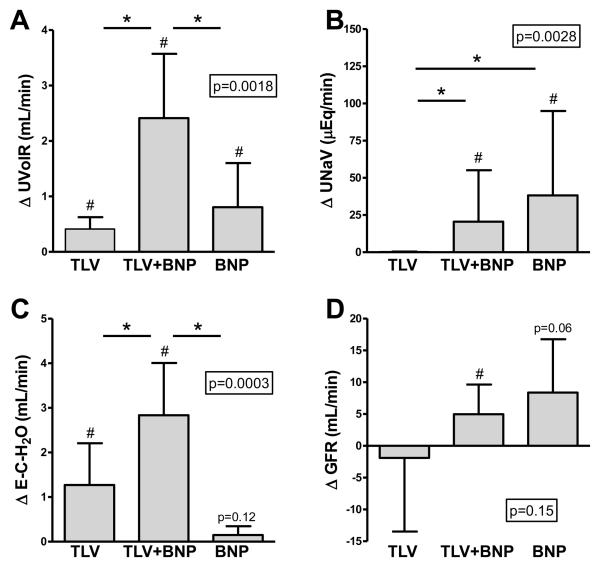
Figure 2.
Change in urine flow (A), urinary sodium excretion (B), electrolyte-free water clearance (C), and glomerular filtration rate (D) with TLV, TLV+BNP, and BNP (A). P-value in box is from ANOVA for comparison of groups. *p<0.05 between groups. #p<0.05 vs. respective baseline. BNP, B-type natriuretic peptide, TLV, tolvaptan. Data is mean (standard deviation) except for (B), which is median (interquartile range).

