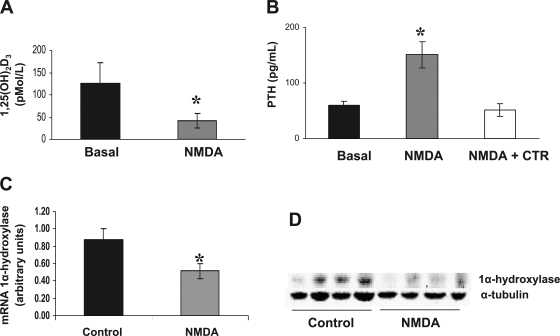
Fig. 3.
A: 1,25(OH)2D3 levels in normal animals before (black bars) and after NMDA treatment (10 mg·kg−1·day−1 for 4 days; gray bars). Values are means ± SE. *P < 0.05 vs. basal. B: PTH levels in normal rats before (black bars) and after NMDA treatment (10 mg·kg−1·day−1 for 4 days; gray bars) or NMDA plus calcitriol (NMDA + CTR; 10 ng/kg every other day). Values are means ± SE. *P < 0.05 vs basal. C: 1α-hydroxylase mRNA levels in kidney tissue from normal animals (control) and from animals treated for 4 days with NMDA (10 mg·kg−1·day−1). Values are means ± SE. *P < 0.05 vs. control. D: representative Western blot of kidney tissue showing a decrease in 1α-hydroxylase protein levels in 3 different animals treated with NMDA (10 mg·kg−1·day−1 for 4 days). We used α-tubulin as load control.

