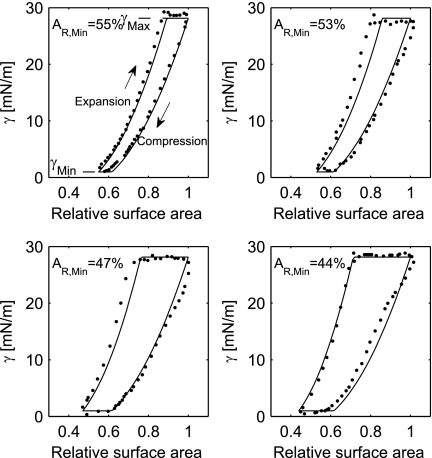
Fig. 2.
The relation between relative surface area (AR) and surface tension (γ) with minimum relative alveolar surface area (AR,Min) of 55, 53, 47, and 44%. Data read from Lu et al. (21) are shown (dots) with corresponding modeled γ (solid curves). The minimal γ (γMin) and maximal γ (γMax) are indicated as well.

