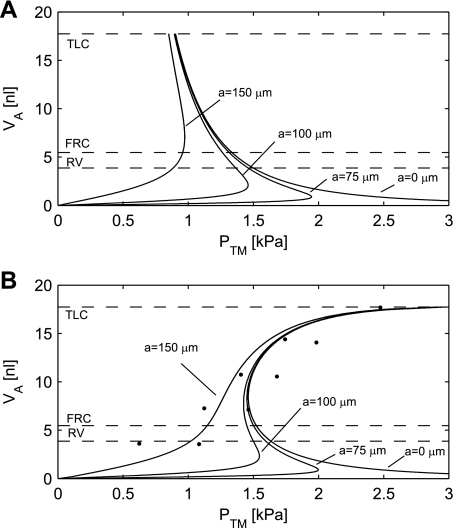
Fig. 5.
A: alveolar pressure-volume (PV) curves for an alveolus without surfactant and tissue elastic properties. B: simulations of the alveolar PV curve with the tissue elastic properties and a constant γ of 73 mN/m. The radius of the rigid ring a varies between 0, 75, 100, and 150 μm. The simulation shows that the tissue elastic properties are capable of stabilizing the alveolus when the opening radius a is 150 μm, however, not for the smaller opening radii. Experimental data are indicated by dots (3). The dashed lines indicate residual volume (RV), functional residual capacity (FRC), and total lung capacity (TLC). The dashed lines represent Va going from maximal volume (TLC) down to 30.8% (FRC) and 21.8% (RV) of maximal volume (Table 1). Ptm, transmural pressure.

