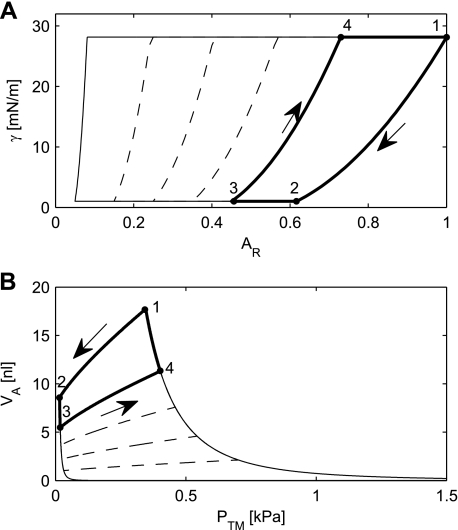
Fig. 6.
A: simulation results of the alveolar γ as a function of the AR. B: simulation results from the same simulations as in A, replotted as an alveolar PV curve. The thick line represents a simulation with Va ranging from maximum Va (VaMax) to Va at FRC (VaFRC) and back. The dashed lines show the behavior that follows from the model of surfactant for deflations going down to relative areas of 5, 15, 25, and 35%.

