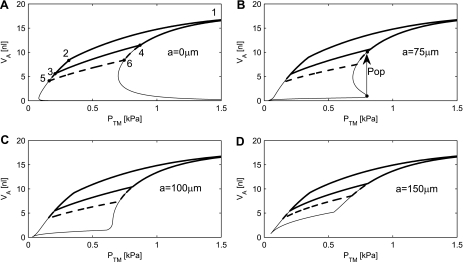
Fig. 8.
The simulated PV relationship of an alveolus, including the mechanical properties of the tissue elasticity and surfactant. The thick line is a simulation with Va ranging from VaTLC to VaFRC and back. The thick dashed line represents the physiological range of volume changes from VaTLC to VaRV. A: the alveolar PV relationship for a = 0 μm. B: with a = 75 μm, the alveolus will “pop” open, once the Ptm exceeds the opening pressure of 0.8 kPa. The Va will suddenly increase, as indicated by the arrow labeled Pop. The bottom thin line shows a simulation of compressions from maximum surface area to 5%. C: further increase to a = 100 μm will eliminate the ability of the alveolus to pop open. D: with a = 150 μm, the alveolus will be completely stable.

