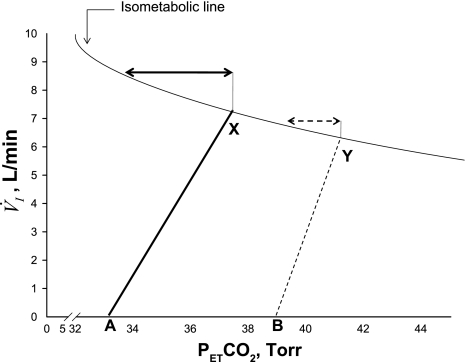
Fig. 3.
Schematic representation of the relationship between minute ventilation (V̇i) and PetCO2 along the isometabolic curve. Note decreased eupneic PetCO2 with hyperoxia (X), compared with sham exposure (Y), indicative of decreased plant gain. There is also a decrease in the slope of V̇i/CO2 with hyperoxia (solid line) compared with sham (dashed line), confirming a decline in the hypocapnic ventilatory responsiveness upon exposure to hyperoxia. The arrows indicate CO2 reserve during the two exposure conditions: greater magnitude of CO2 reserve with hyperoxia (solid arrow) compared with sham room air exposure (dashed arrow). Points A and B represent AT during hyperoxia and sham, respectively.

