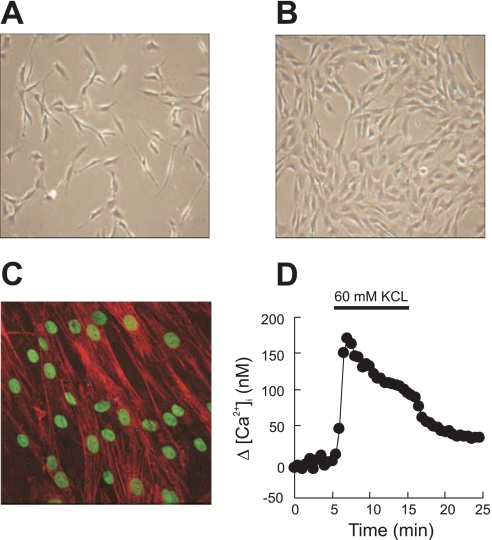
Fig. 1.
Representative phase-contrast microscopy images (objective ×20) of rat distal pulmonary venous smooth muscle cells (PVSMC) in 2–3 days of culture (A) and 4–6 days of culture (B). C: α-actin fluorescent immunostaining in red, with nuclei counterstained in green in PVSMC cultured for 4–6 days (objective ×40). D: representative traces of time course of [Ca2+]i responses to KCl (60 mM) in rat distal PVSMC.

