Fig. 5.
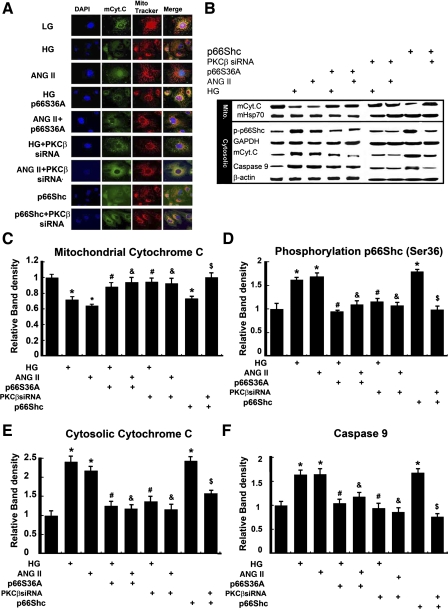
Effect of p66Shc on the HG- or ANG II-induced cytochrome c (Cyt.C) release. A: confocal microscopy revealed that, at a basal low concentration of d-glucose (LG, 5 mM), the Cyt.C is localized in the mitochondria (mCyt.C), as detected by anti-mCyt.C antibody (green, column 2) or Mitotracker dye (red, column 3). With the treatment of 30 mM d-glucose (HG) or ANG II (10−7 M), the Cyt.C was released into cytosol, and the release was inhibited by transfection of p66ShcS36A or PKC-β-siRNA. B: distribution of p-p66Shc, Cyt.C, and caspase-9 in mitochondrial vs. cytoplasmic compartments following various treatments, as assessed by WB analysis, with mitochondrial heat shock protein 70 (mHSP70) or GAPDH served as loading controls. C–F: the bar graphs represent a summary of WBs reflecting expression of mCyt.C (C) cytosolic Cyt.C (E), p-p66Shc (D), and caspase-9 (F). The HG or ANG II induced a decrease of mCyt.C and increase of p-p66Shc, cytosolic Cyt.C, and caspase-9, while overexpression of p66ShcS36A mutant or treatment of PKC-β-siRNA reversed these changes. Transfection of p66Shc WT had similar effects, as induced by HG or ANG II treatments on the expression of Cyt.C, p-p66Shc, and caspase-9, and they were inhibited by PKC-β-siRNA. DAPI, 4,6-diamidino-2-phenylindole. Values are means ± SE; N = 6. *P < 0.01 vs. control of 5 mM d-glucose. #P < 0.01 vs. 30 mM d-glucose. & P < 0.01 vs. ANG II (10−7 M). $ P < 0.01 vs. p66SShc WT.

