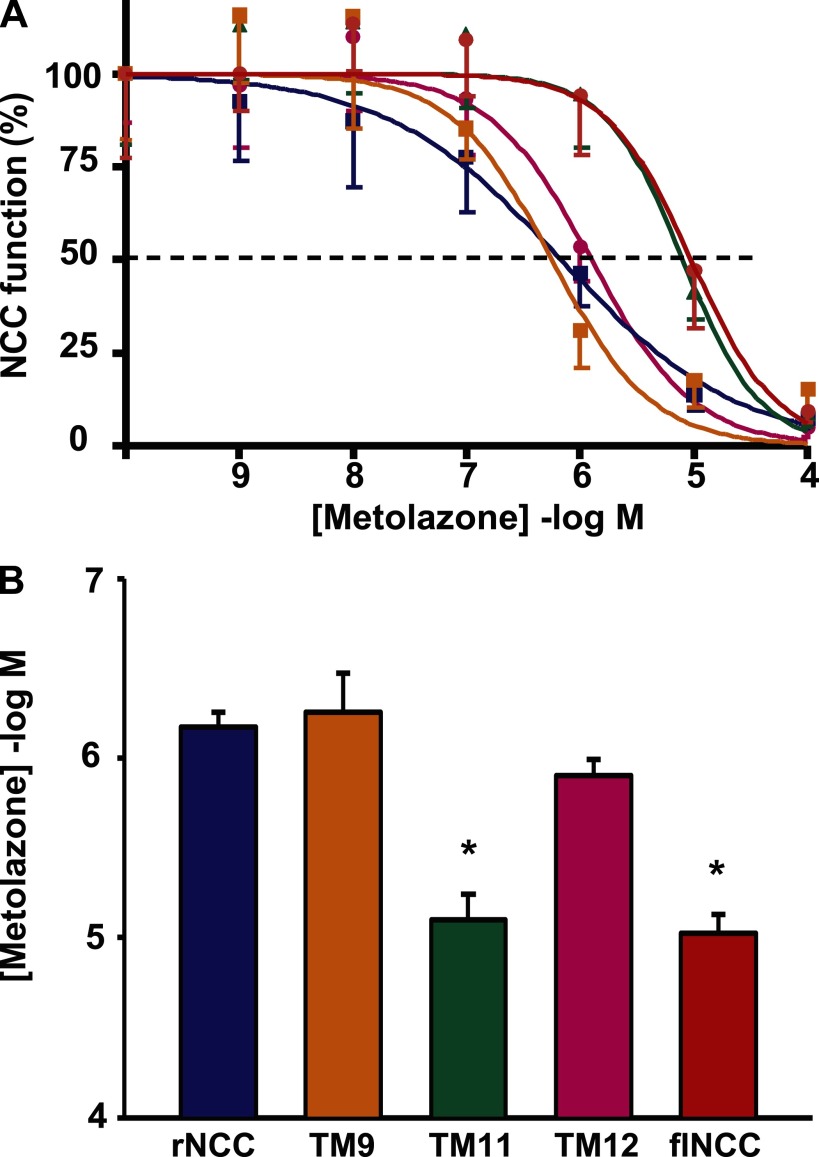
Fig. 3.
The effect of TM mutations on rat NCC (rNCC) affinity for metolazone. Metolazone dose response analysis was assessed in 5 different experiments, in all of which the 5 different clones were tested simultaneously, using the same uptake solutions and metolazone dilutions. A: a compilation of the dose-response curves from the 5 experiments is shown. Wild-type rNCC (blue), wild-type flounder NCC (flNCC; red), TM9 mutant (orange), TM12 mutant (pink), and TM11 mutant (green). Data were fit to the Hill equation, and in all cases Hill coefficients close to unity were obtained. All group data are shown as means ± SE of %activity. The coefficient of determination (r2) was between 0.95 and 0.99 for the fits shown. B: metolazone IC50 for rNCC and mutants calculated from the nonlinear regression fit of uptake data to the Hill equation. Data are shown as mean IC50 ± SE of 5 different experiments. *P < 0.05 vs. rNCC.

