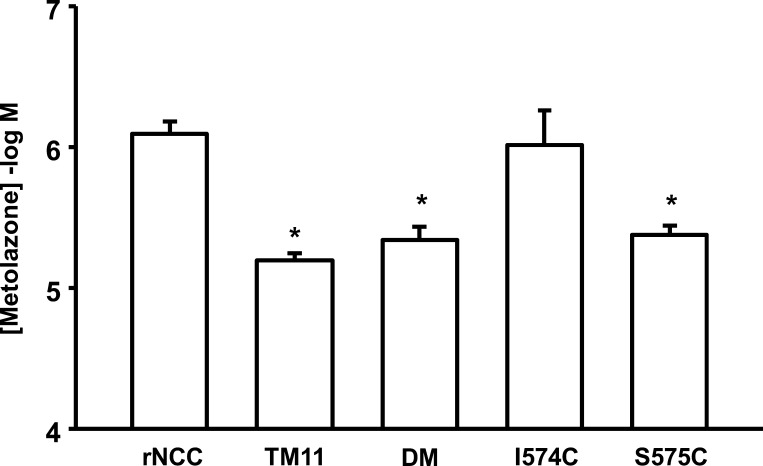
Fig. 4.
The effect of individual mutations in the rNCC TM11 segment on the affinity for metolazone. Methods are similar to those explained in Fig. 3, and 5 different experiments were performed. The bars represent mean IC50 ± SE for each tested clone, as stated. For each experiment, all Hill slopes were ∼1 and coefficients of determination (r2) were between 0.92 and 0.99. *P < 0.05 vs. rNCC.

