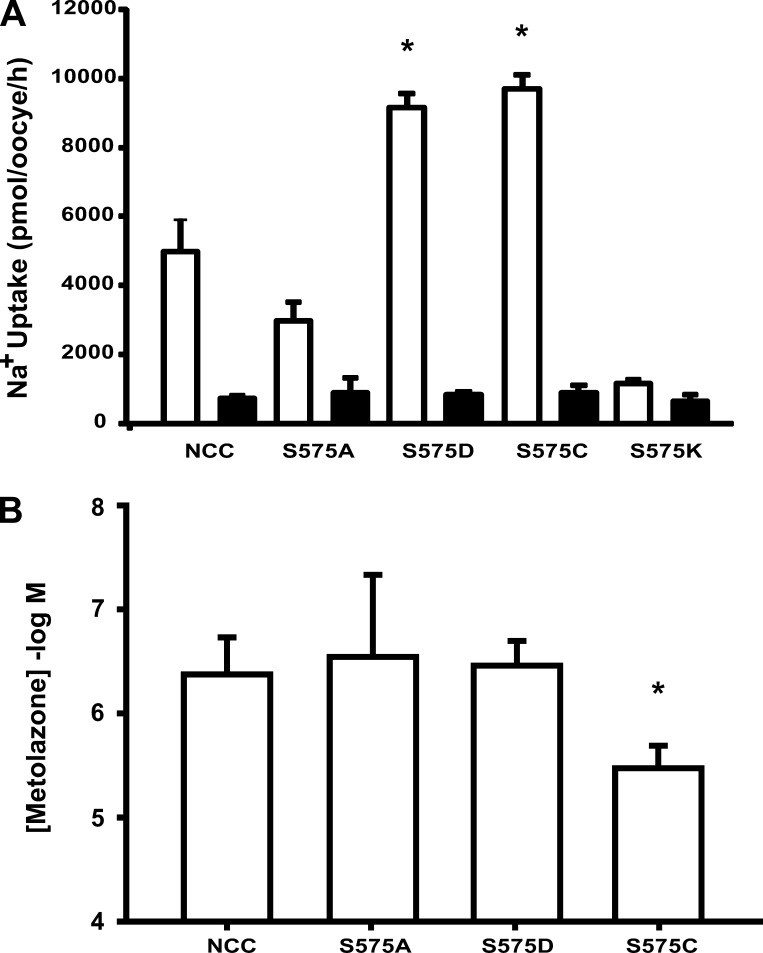
Fig. 7.
Functional expression and metolazone affinity of mutant rNCCs S575C, S575A, S575D, and S575K. Oocytes were injected with cRNA from each mutant clone. A: 3 days later, the 22Na+ uptake was assessed in the absence (open bars) or presence (closed bars) of 100 μM metolazone. Data are means ± SE. B: metolazone IC50 values for rNCC and mutants were calculated from the nonlinear regression fit of uptake data to the Hill equation. Data are shown as mean IC50 ± SE of 3 different experiments. *P < 0.05 vs. rNCC.

