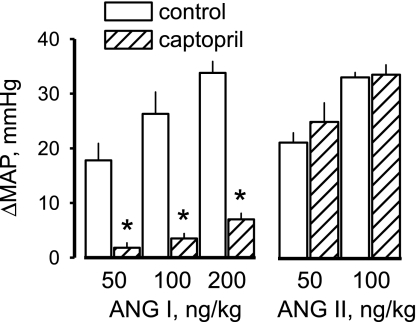
Fig. 1.
Peak change in mean arterial pressure (MAP) in response to intravenous injections of ANG I and ANG II. Control responses were obtained, then captopril was added to the infusate, and responses were obtained again 1 h later. Values are means ± SE. *Significantly different from control, P < 0.01.

