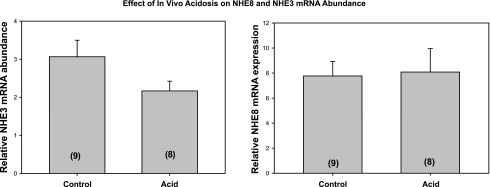
Fig. 3.
Effect of metabolic acidosis on NHE3 and NHE8 mRNA abundance. NHE3 and NHE8 cDNA from total mice kidney was analyzed by real-time PCR normalized to 28S mRNA. There was no significant difference in the control vs. acid groups for either NHE3 or NHE8 mRNA expression. No. of mice is in parentheses.

