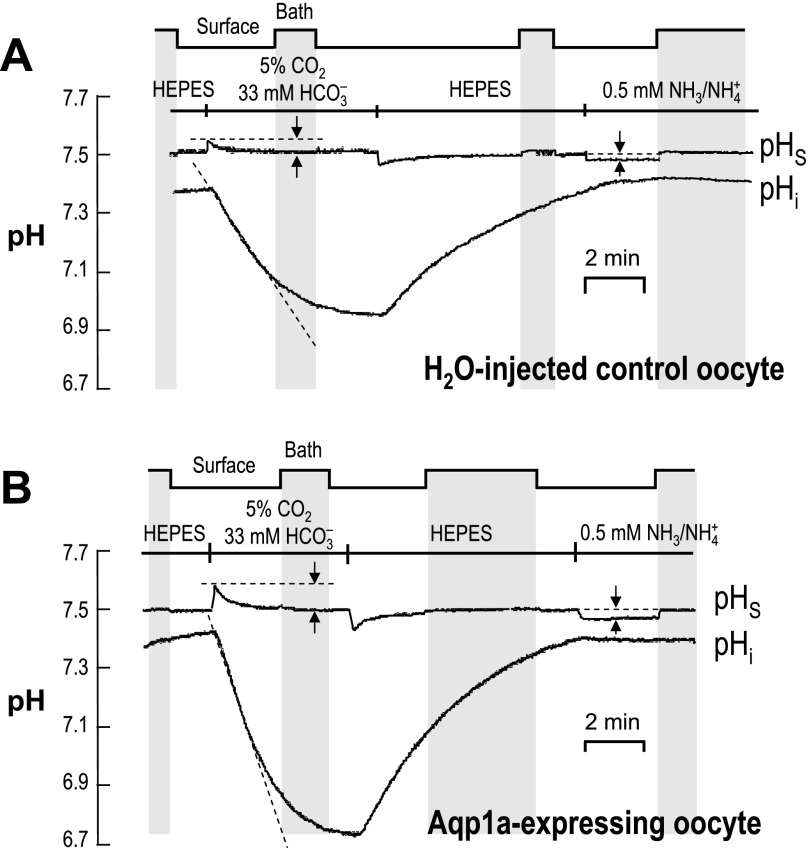
Fig. 6.
Recordings of surface and intracellular pH. A: typical pH records from a control Xenopus oocyte injected with H2O. The step chart at the top and the vertical gray bars indicate periods during which the extracellular pH electrode was moved away from the cell surface for calibration. Extracellular solutions were changed, as indicated, in the order HEPES → CO2/HCO3− → HEPES → NH3/NH4+. The upper trace represents surface pH (pHS), with the pairs of vertical arrows indicating the maximal pHS changes elicited by exposure to CO2/HCO3− or NH3/NH4+. The lower trace indicates intracellular pH (pHi), with the sloped dashed line indicating the initial rate of pHi decline. B: typical pH records for pHS (upper trace) and pHi (lower trace) from a Xenopus oocyte injected with 25 ng of aqp1a cRNA.

