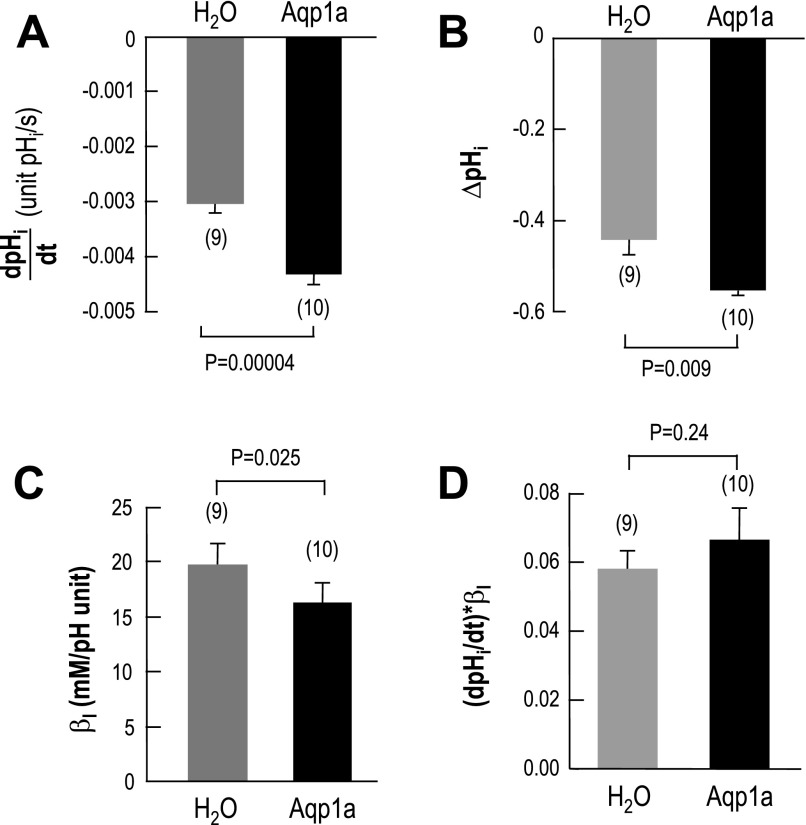
Fig. 7.
Summary of intracellular-pH data. A: summary of the maximal rate of pHi decline (dpHi/dt) produced by the switch from HEPES to 5% CO2-33 mM HCO3− in H2O-injected or Aqp1a-expressing oocytes. B: summary of changes in steady-state pHi produced by the application of 5% CO2/33 mM HCO3−. C: summary of the intrinsic intracellular buffering power (βI) of H2O-injected or Aqp1a-expressing oocytes, computed from ΔpHi data (see B) of individual oocytes. D: initial rate of cytosolic H+ production from CO2. For each oocyte, the dpHi/dt value was multiplied by the respective βI value computed for that oocyte.

