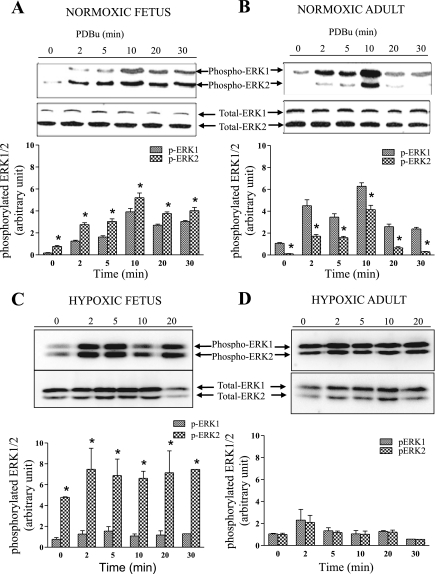
Fig. 3.
Western immunoblots and histograms (densitometric analysis) of phosphorylated ERK1 (p-ERK1, p44) and ERK2 (p-ERK2, p42) showing time course of PDBu (3 × 10⁻⁶ M)-induced activation of ERK1/2 in cerebral arteries from normoxic fetus (A), normoxic adult (B), and hypoxic fetus (C), and hypoxic adult (D) cerebral arteries at 2, 5, 10, 15, 20, and 30 min. Levels of total ERK1/2 are also shown. Histograms demonstrate relative integrated density of phosphorylated ERK1 and ERK2. Values are means ± SE; n = 5 for each group. *P < 0.05 compared with control.

