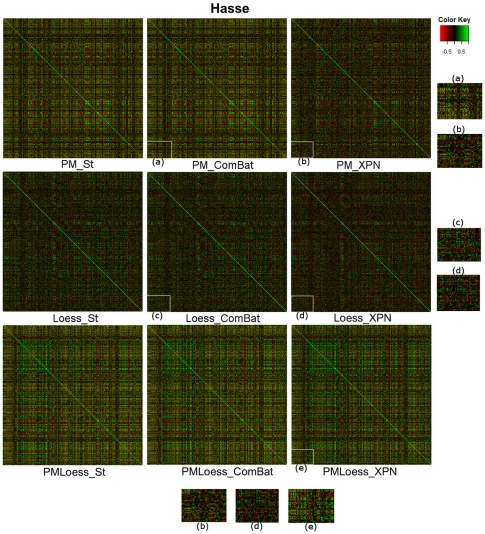
Figure 4. Correlation matrices for Hasse dataset (single-channel), for each normalisation technique.
Enlarged areas, labelled (a), (b), (c), (d), (e) are provided for better visualisation. Images show that XPN cross-platform normalisation decreases high correlations compared to ComBat and Standardisation ((a) vs. (b) and (c) vs. (d)) while Standardisation and ComBat yield same correlation values. Also, PM methods display a higher number of strong correlations ((a) vs. (d) and (e)). These effects are studied further in text by providing values for aggregated criteria from the correlation matrices.

