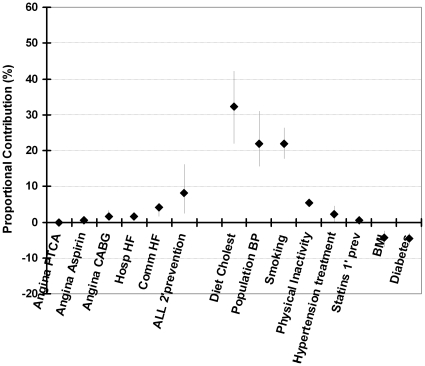
Figure 2. The proportional contributions of specific risk factor treatments and risk factor changes to the overall decrease in CHD mortality in Iceland between 1981 and 2002.
The bars show the observed deaths in each age group, with diamonds being the best model estimate, and vertical lines the extreme minimum and maximum estimates in the sensitivity analysis.

