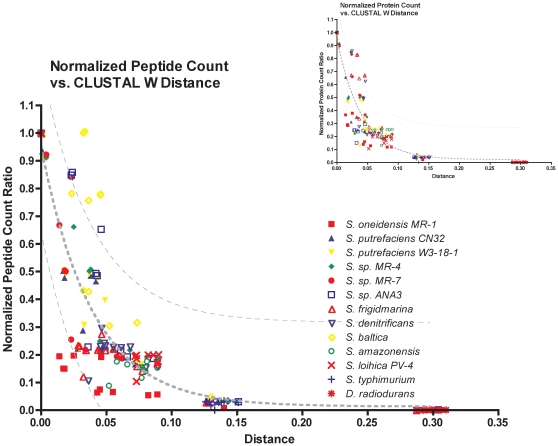
Figure 1. Peptide conservation (inset: protein conservation) was examined across the different species by graphing the normalized number of observed peptides (proteins) with respect to evolutionary distance.
As the distance increases, the number of successfully identified features decreases. Data were fit to a one-phase exponential decay; 95% confidence interval for the observed features is shown with a hashed line. Each point represents the reference proteome peptide count relative to the near neighbor peptide count.

