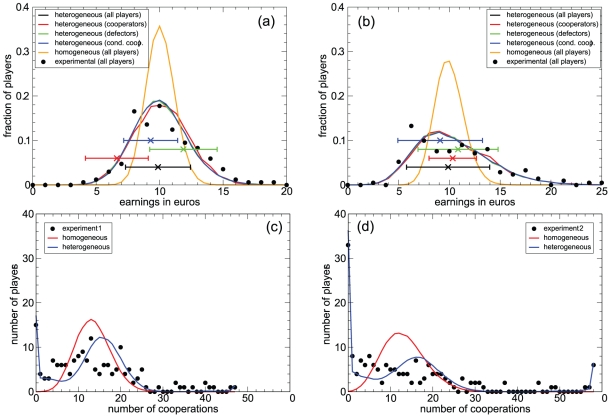
Figure 3. The heterogeneous model reproduces the earning and cooperation histograms and supports the coexistence of different types of players.
Panels (a) and (b): Histograms of earnings in simulations of the heterogeneous model, for all players aggregated (black line, hidden by the blue line) as well as for the three basic types of players: pure and mostly cooperators (red line), pure and mostly defectors (green line), and conditional cooperators (blue line); histograms of earnings in simulations of the homogeneous model (orange line); and experimental histograms of earnings for all players aggregated (black dots). Results are presented for both experiment 1 (a) and experiment 2 (b). Simulations results are averages over 1000 runs. Crosses ( ) represent the mean earnings in the real experiments (their Y coordinate is arbitrary). Error bars span two standard deviations. Clearly, simulations of the homogeneous model do not fit the experimental data, thus supporting the introduction of the heterogeneous model. There is a reasonable consistency between experimental results and numerical simulations for the heterogeneous model, more so in experiment 2, where players are supposed to be playing with a better defined strategy. In experiment 1, the longer cooperative transient makes defection a more favorable strategy. The fact that the histograms for the different kinds of players are indistinguishable supports the coexistence of strategies, as there is no real incentive (on average) to switch from one strategy to any other. Panels (c) and (d): Number of players who cooperate a given number of rounds, both for experiment 1 (c) and experiment 2 (d). The experimental results are plotted together with the results of simulations with the homogeneous and the heterogeneous models, averaged over 1000 realizations. Once again, the homogeneous model is not able to reproduce the experimental results.

