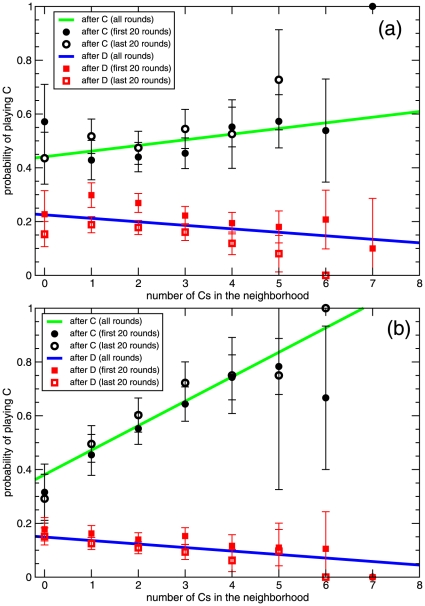
Figure 4. Conditional cooperators' strategies (almost) do not change over time.
Same as Figure 2 for the case with all players in experiments 1 (a) and 2 (b). Straight lines are the fit appearing in Figure 2, whereas points are the strategies as obtained only from the first 20 rounds (full symbols) and only from the last 20 rounds (empty symbols). The strategies are statistically the same for experiment 2, and for the experiment 1 after having played C in the previous round. After having played D in the previous round in experiment 1, the probability of cooperating noticeably decreases over time down to a value compatible with that observed in experiment 2.

