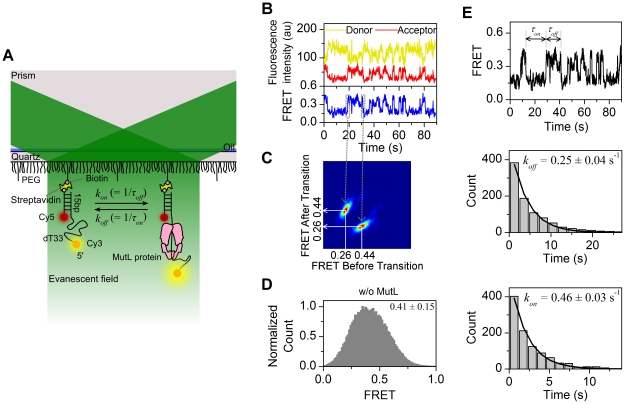
Figure 1. Single-molecule FRET analysis of MutL-ssDNA binding.
(A) Schematic representation of a single-molecule FRET system. The Evanescent field resulting from Total Internal Reflection excites a Cy3 donor fluorophore that may FRET with a Cy5 acceptor fluorophore. A partial duplex DNA attached to the PEG-biotin surface via a biotin-streptavidin linker contains a 5′-dT33 single-stranded tail labeled with the donor Cy3 and an acceptor Cy5 linked to the dsDNA/ssDNA junction. The distance between fluorophores changes with MutL-ssDNA binding affecting the FRET efficiency. (B) Representative single molecule trace of the Cy3 and Cy5 fluorescence intensity (top panel) and the resulting FRET (bottom panel) with 50 nM MutL in 25 mM NaCl. The binding of MutL reduces the FRET. (C) A transition density plot in the presence of MutL. There are two FRET states of 0.44 and 0.26 FRET values, respectively. The plot consists of 2,362 transitions from 257 traces. (D) Histogram of FRET values from populations of single molecules normalized to the peak count. The FRET efficiency in the absence of MutL is 0.41±0.15 (mean ± s.d.; n = 74,634 points). (E) Representative trace in the presence of 50 nM MutL in 25 mM NaCl. The FRET efficiency for τon and τoff represent the association and dissociation time of MutL, respectively (upper panel). Rate constants, kon = 1/τoff and koff = 1/τon were determined by fitting an exponential decay function to the histogram derived from a population of dwell times (lower panels).

