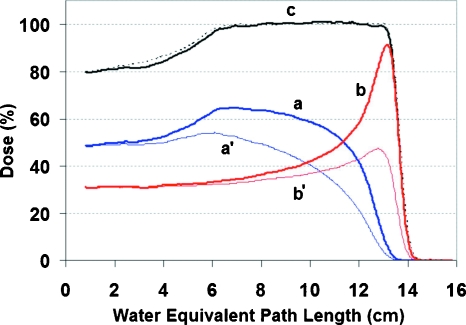
Figure 4.
Depth doses for the type II field pair used in the experiment. The distributions (a) and (b) correspond to beam pulse patterns (a) and (b) in Fig. 2 and were measured with a Markus chamber. They were scaled in the figure such that their sum has a (c) constant dose plateau, as by a conventional dose delivery. The distributions (a′) and (b′) were computed with the LET correction based on the time-resolved data obtained in measuring (a) and (b). The depth-dose measured without splitting the field delivery is shown in the dotted line.

